


Intuitive, graphical model data editing
The geometry is digitized from a bitmap or imported if digital data (ASCII, dxf, ESRI Shapefile, OSM) is available. Interfaces to Google Maps and OpenStreetMap are also available.
The noise sources (roads, railways, parking lots, point, line, and area sources, stages) as well as the objects that influence the sound propagation path (e.g., buildings, noise barriers, or ground properties) are entered in the editor. The data model is completed with receivers for single-point analyses or the calculation area for noise maps. The entire model can be displayed as a wireframe model and in 3D, making it easy to check the data.
Definition of emissions
For roads and railways, emissions are calculated based on traffic data and other acoustically relevant properties (e.g., road surfaces, bridge structures) in accordance with the selected standard. For industrial noise sources, the extensive emissions library offers a wide selection of supplied spectra, which you can expand with your own emissions spectra.
Multicore and multithreading for fast calculations
The quality-tested SoundPLAN calculation core quickly and efficiently performs standard-compliant calculations for road, railway, and industrial noise. Multiple noise types are calculated together. When displaying results in tables and graphics, noise types can be evaluated individually, in combinations, or as sum levels.
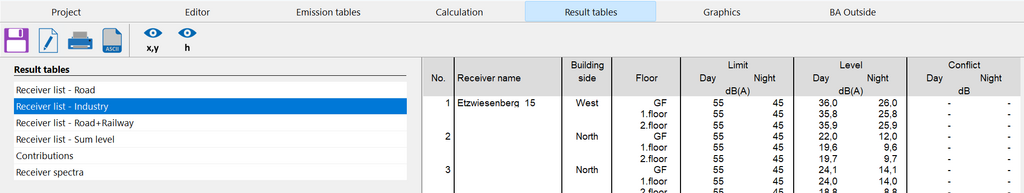
Tabular documentation
The emission values for the various noise sources and the results, including contribution levels and propagation parameters, are documented clearly and comprehensively in tables that you can easily include in your reports.
Graphical presentation of results
The calculation results for individual receivers are presented in small tables together with the model data. If desired, limit lines can used to illustrate the noise situation even more clearly. Colored noise maps are used to visualize sound propagation at any height above the terrain.